

As crypto prices soar into the stratosphere, it's easy for traders to forget the law of gravity. Sometimes, it seems like there's no end in sight for a massive rally, but price dips are a natural part of the crypto market's dynamics.
Traders often try to avoid these sharp sentiment shifts long before they happen by carefully reviewing technical indicators and chart patterns. For example, if a shooting star pattern appears, some crypto traders take extra precautions with their current positions. Identifying a shooting star early gives traders a heads-up on a crypto asset's trajectory, potentially protecting their portfolios from a price plummet.
Instead of wishing upon a shooting star, most crypto traders wish these patterns never showed up in the first place. Let’s define a shooting star pattern, how to interpret it, and how to trade it.
What is a shooting star in crypto?
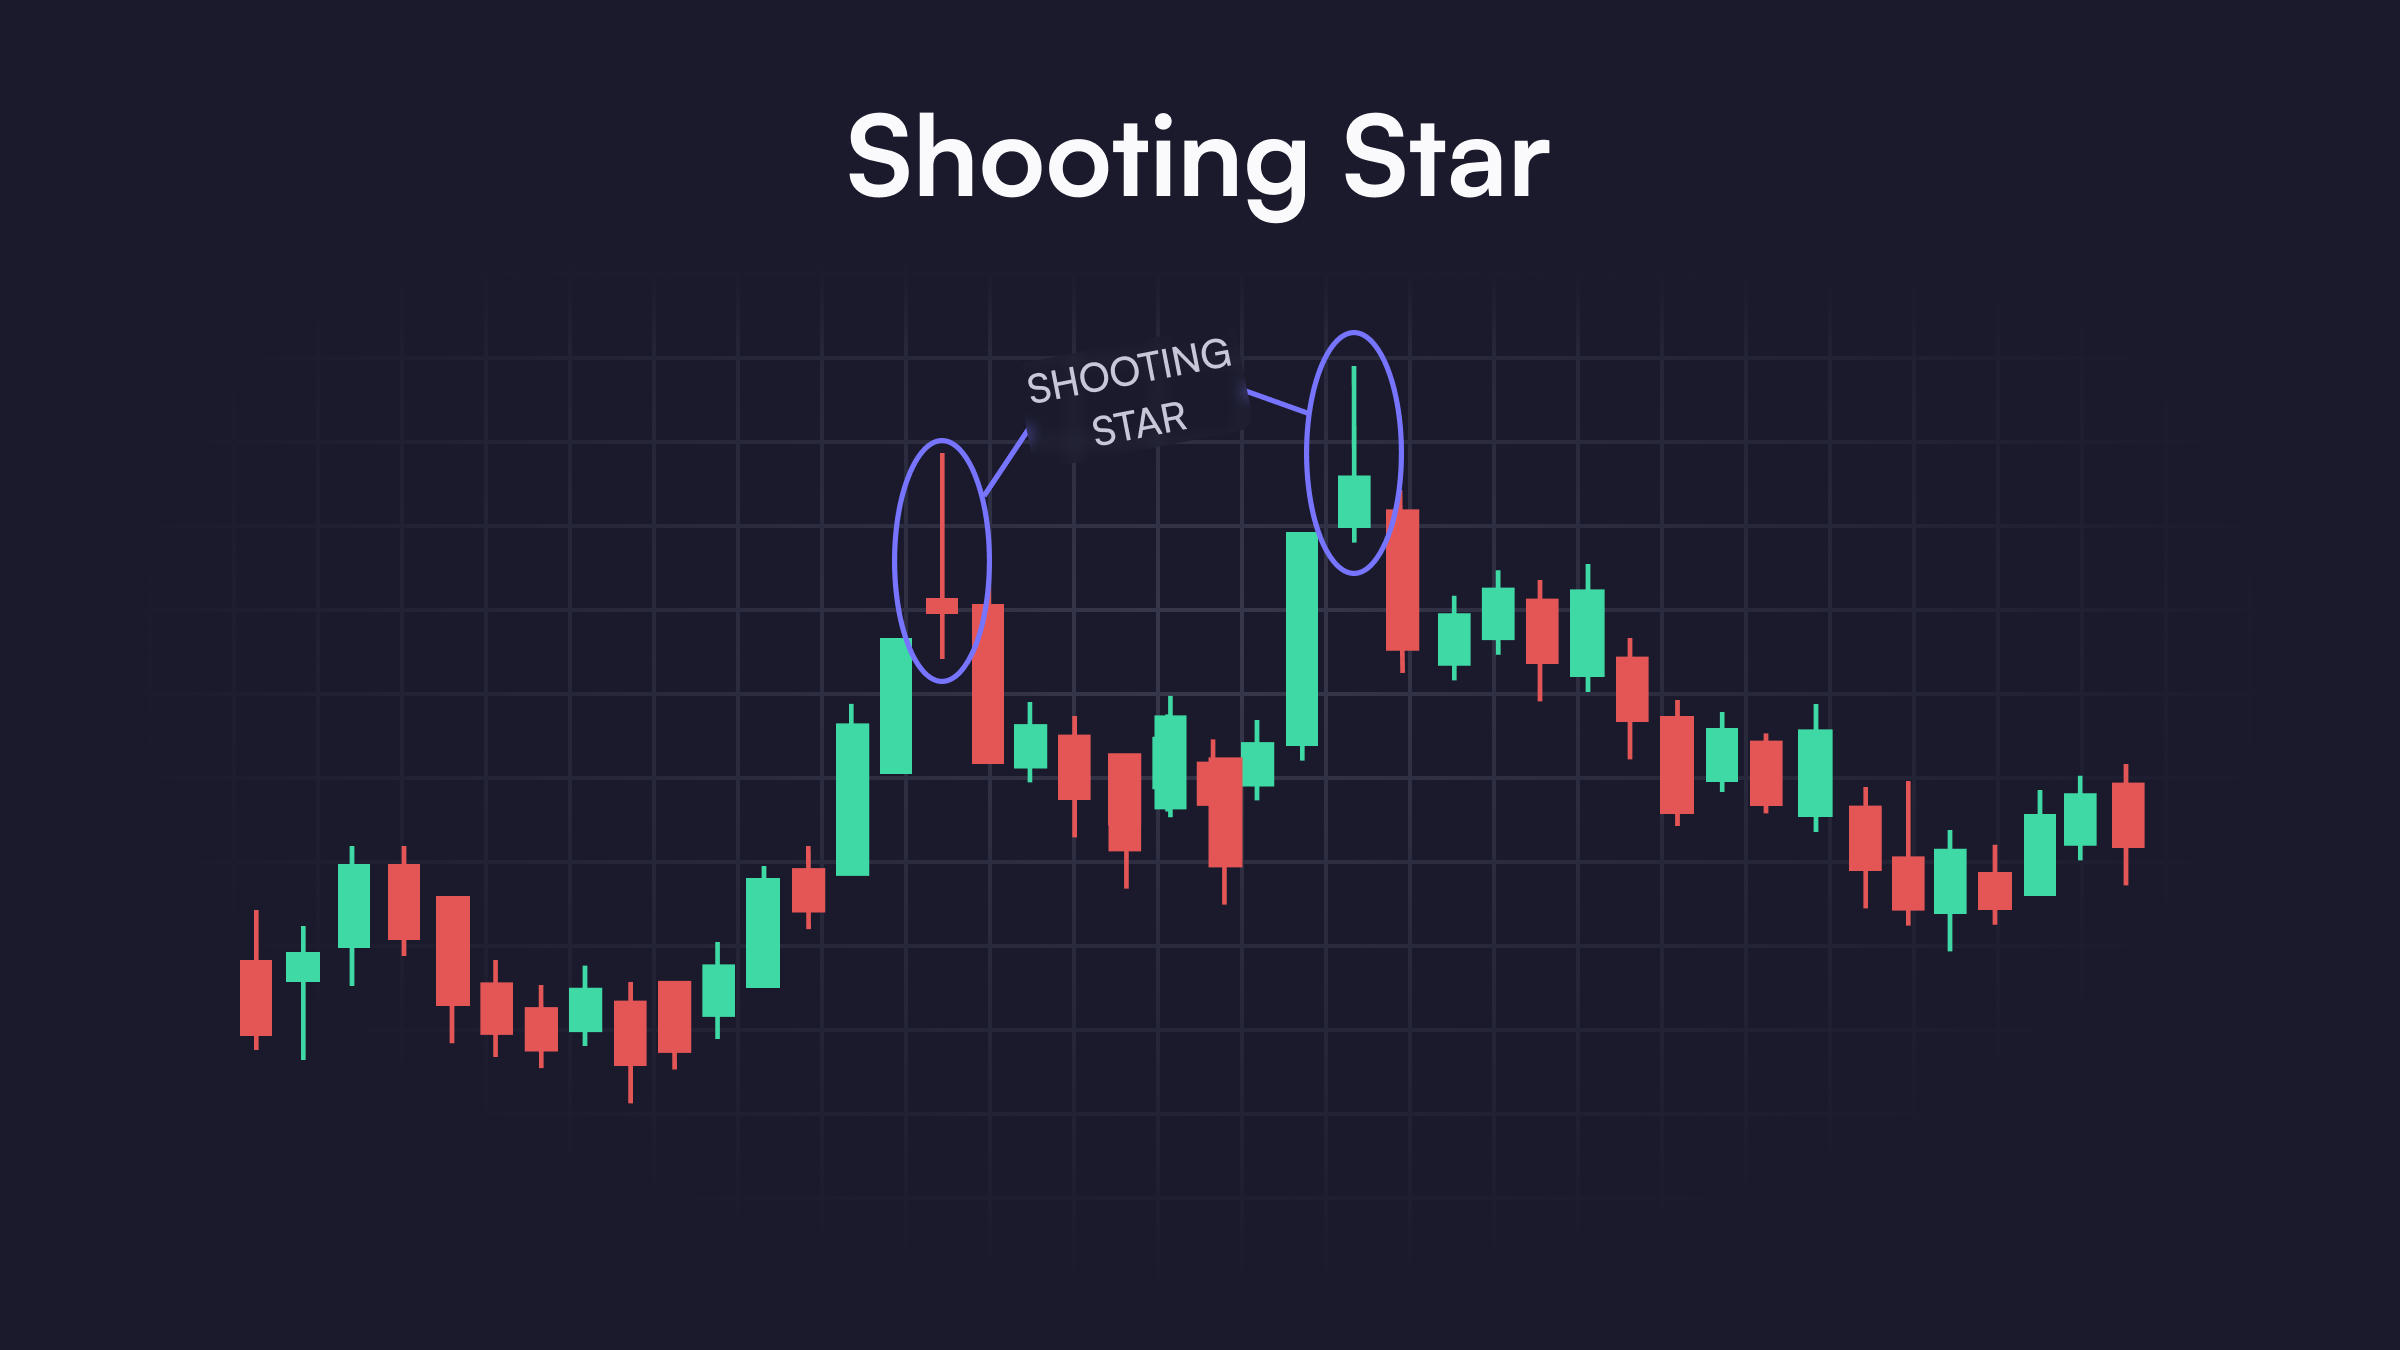
The shooting star pattern is a distinctive image on a price chart where one candlestick looks like a falling meteor with a short, fat body on the bottom and a long, thin upper tail. Traditionally, this pattern is a warning sign of a price reversal from previous upward (aka bullish) momentum to a downward (aka bearish) trend.
While finding the shooting star pattern in commodities, and other asset categories is possible, shooting stars in cryptocurrency focus on virtual currencies like Bitcoin (BTC) and Ethereum (ETH).

(Source: Forex Training Group)
The body of a shooting star shows where an asset's price traded for most of the session and where it closed. If this candlestick is green, the cryptocurrency closed at the top of the body's range, while red candlesticks closed at the lows.
The thin "shadow" line on the top of the candle (or the wick) represents the highest price a cryptocurrency traded during the session. The distinctively long length of a shooting star's upper wick suggests buyers tried to push the cryptocurrency higher, but they can be quickly met with intense selling pressure during the price advance.
Standard features of shooting star candlestick patterns
Like spotting shooting stars for stocks, a shooting star in cryptocurrency only appears during a sustained bullish rally. When a shooting star candlestick appears during an uptrend, it must have an upper shadow at least double the length of the lower body with no wick underneath.
To confirm the shooting star's bearish bias, traders pay careful attention to the candles in the subsequent trading sessions. If the following candles close lower than the shooting star's closing price, there's greater evidence this pattern is a genuine bearish indicator and a digital asset’s price trends downward.
Crypto traders also watch the average daily trading activity on a cryptocurrency's volume charts when analyzing a shooting star pattern. If there's higher-than-average selling volume for a cryptocurrency after a shooting star materializes, there's even more reason to believe the bears have the upper hand, and it's more profitable to enter short positions.
Shooting star trading: How to use the shooting star in crypto
Because shooting stars might suggest a price drop is around the corner, crypto traders often consider it a warning alarm. Whether long-term traders want to hedge losses in their holding (or HODLing) positions or day traders want to speculate on price volatility, they often gravitate toward strategies and products designed to profit from declines.
For example, traders sometimes short a virtual currency or buy derivatives like puts or short perpetuals that increase as a cryptocurrency falls. Some traders also use shooting stars to exit crypto investments at a price high to avoid downside risk.
If traders use shooting stars to enter short positions, they usually wait to see if the succeeding candles confirm the bearish momentum with falling prices. If the following candlesticks fall below prior levels, traders start a short position below the low of the shooting star. For extra protection, they might place automatic sell orders (aka stop-losses) at the top of a shooting star's body or wick to quickly exit a losing position.
Pros and cons of the shooting star pattern
The shooting star seems like a surefire way to tell when a cryptocurrency rally is losing steam, but it's not a foolproof strategy. Traders must weigh the pros and cons of using a shooting star before incorporating it into a trading thesis.
Pros
Easy to identify: Shooting stars have an eye-catching appearance that's difficult to miss on a cryptocurrency's price chart. Even if traders aren't skilled with technical analysis tools, picking out a shooting star is easy––thanks to this candlestick's super long shadow.
Clear entry zones: A shooting star candlestick has precise opening and closing prices on its body and a clear upper limit on its signature wick. Traders use these well-defined prices to choose their ideal entry levels based on risk-to-reward preferences.
Compatible with other technical indicators: When traders see a shooting star, they often compare it with tools like the relative strength index (RSI), moving average convergence divergence (MACD), or Ichimoku cloud for a comprehensive overview of a cryptocurrency's momentum. If more of these indicators lean bearish, it adds credibility to a shooting star's expected outcome.
Cons
Heavy dependence on confirmation signals: Typically, traders don't enter a short position immediately after seeing a shooting star pattern. Instead, they wait for at least one succeeding candlestick to confirm a bearish reversal, by which time traders sometimes miss the optimal short entry point.
Can't distinguish between resistance and trend reversals: Traders wait for confirmation after a shooting star because this pattern sometimes highlights a strong resistance zone rather than a trend reversal. There's no way to know what a shooting star means until there's more price data, and short traders always risk entering a false signal.
Unclear where to take profits: While shooting stars provide precise price levels for entering a trade, measuring the expected gain from a short position isn't straightforward. Traders have to review their risk-to-reward expectations and prior support and resistance lines to set a clear profit target.
Inverted hammer versus shooting star pattern: Key differences
Like a shooting star, an inverted hammer pattern is a reversal signal defined as a candlestick with a short lower body and a massive upper wick.
The key difference between inverted hammers and shooting stars is the former pattern plays out during a downtrend, while the latter happens during a rally. If an inverted hammer appears on a cryptocurrency's price chart, traders might assume the sellers are getting exhausted, and an upward move is imminent—especially if the succeeding candlesticks close in the green above the inverted hammer's levels.
Spot more technical patterns on dYdX Academy
For more details on technical analysis and trading strategies, visit dYdX Academy. From identifying opportunities like the golden cross to avoiding pitfalls like bear traps, dYdX Academy has dozens of guides on all aspects of trading cryptocurrencies.
dYdX also offers a decentralized trading platform for eligible traders interested in swapping crypto perpetual contracts. Find out the full details on dYdX's latest products, features, and upgrades on our official blog, and eligible traders can start trading on dYdX today.
Disclosures
The content of this article (the “Article”) is provided for general informational purposes only. Reference to any specific strategy, technique, product, service, or entity does not constitute an endorsement or recommendation by dYdX Trading Inc., or any affiliate, agent, or representative thereof (“dYdX”). Use of strategies, techniques, products or services referenced in this Article may involve material risks, including the risk of financial losses arising from the volatility, operational loss, or nonconsensual liquidation of digital assets. The content of this Article does not constitute, and should not be considered, construed, or relied upon as, financial advice, legal advice, tax advice, investment advice, or advice of any other nature; and the content of this Article is not an offer, solicitation or call to action to make any investment, or purchase any crypto asset, of any kind. dYdX makes no representation, assurance or guarantee as to the accuracy, completeness, timeliness, suitability, or validity of any information in this Article or any third-party website that may be linked to it. You are solely responsible for conducting independent research, performing due diligence, and/or seeking advice from a professional advisor prior to taking any financial, tax, legal, or investment action.
You may only use the dYdX Services in compliance with the dYdX Terms of Use available here, including the geographic restrictions therein.
Any applicable sponsorship in connection with this Article will be disclosed, and any reference to a sponsor in this Article is for disclosure purposes, or informational in nature, and in any event is not a call to action to make an investment, acquire a service or product, or purchase crypto assets. This Article does not offer the purchase or sale of any financial instruments or related services.
By accessing this Article and taking any action in connection with the information contained in this Article, you agree that dYdX is not responsible, directly or indirectly, for any errors, omissions, or delays related to this Article, or any damage, injury, or loss incurred in connection with use of or reliance on the content of this Article, including any specific strategy, technique, product, service, or entity that may be referenced in the Article.


