Crypto traders prioritize spotting potential parabolic rallies long before they're public knowledge. With positions in place before prices soar, traders reap the benefits of breakouts rather than chasing missed opportunities. But they face a major challenge when implementing this strategy: finding the best time to buy.
Although predicting price pumps isn't easy, a few technical indicators help traders evaluate market sentiment and gauge success probability. One such tool is the golden cross pattern, which is commonly used in technical trading circles to determine the likelihood of bullish price action.
Golden crosses don't tell the whole story, but they’re a valuable piece of data to consider when constructing trades. Learn about what a golden cross is, its pros and cons, and how to find it when scanning a cryptocurrency's price chart.
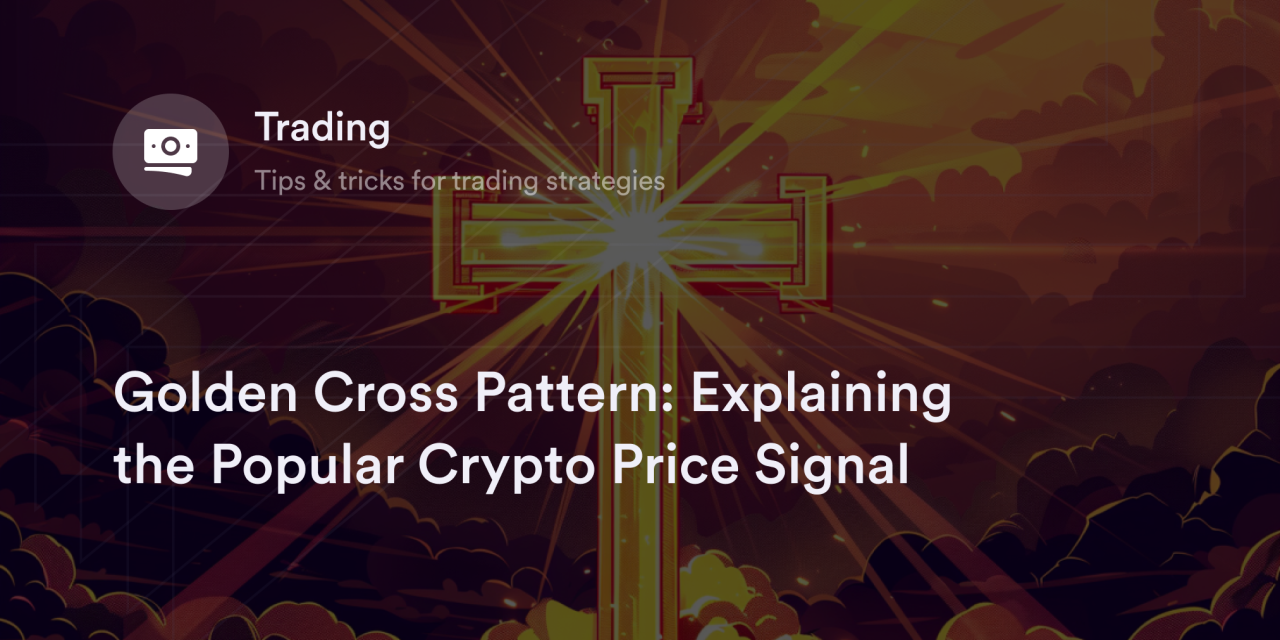
What is a Golden Cross Pattern?
A golden cross is an image on a cryptocurrency's price chart that forms when a short-duration moving average (MA) crosses above a long-term MA. In technical analysis, MAs are trendlines showing a crypto asset’s median market price within a specific timeframe.
For example, Bitcoin's (BTC) 50-day MA shows the median price for BTC according to the prior 50 days of price data, while the 200-day MA takes the average price within the past 200 days. When a golden cross occurs, the MA with the shorter time frame rises above the long-duration MA, suggesting current prices are in an uptrend.
Although golden crosses don't guarantee a digital asset is destined for higher prices, these patterns are closely associated with bullish momentum and often serve as a buy signal for traders.
How to Identify a Golden Cross Chart Pattern
Looking for a golden cross involves a pretty straightforward process. Here’s what you need to do:
Open a cryptocurrency's price chart and plot two MAs with different timeframes. Typically, traders use the 50-day and 200-day MAs when looking for golden cross patterns, but this strategy works with any combination of shorter- and longer-duration MAs.
Once the MAs are on the cryptocurrency's price chart, see if the shorter-term MA ever crosses above the long-term trendline. For example, if you see the 50-day cross above the 200-day MA, you've found a golden cross.

Golden Cross Versus Death Cross: The Key Differences
The golden cross has a macabre-sounding counterpart called the death cross, which is another cross-shaped chart pattern made with two MAs. The critical distinction between golden crosses and death crosses has to do with the way the shorter-term MA crosses the longer-duration trendline.
If the shorter-duration MA sinks below the long-duration MA, it's a death cross. Because near-term prices appear to be falling in this situation, death crosses are bearish signals and suggest the market price for a cryptocurrency is headed to Hades. When crypto traders see a death cross approaching, they often use it as an opportunity to set sell orders like stop losses or use derivatives like short perpetuals to hedge their positions.
Benefits and Limitations of Golden Cross Trading
Finding golden crosses is an easy and popular way to scan the cryptocurrency market for bullish sentiment, but this metric doesn't always spot "golden" opportunities. Crypto traders must consider the potential risks and drawbacks of using golden crosses before opening positions.
Golden Cross Pros
Easy to identify and understand: Unlike advanced technical indicators like the Ichimoku Cloud and Fibonacci retracements, traders of all skill levels can spot and interpret golden crosses. The simple nature of the golden cross pattern makes it one of the most accessible indicators to find and factor into a market analysis.
Provides useful info on market sentiment: Golden crosses show there's strong recent buying activity for a crypto asset, which suggests more near-term traders are optimistic about a crypto asset's future. Although there's always the potential for a trend reversal, this data helps traders understand the market’s overall mood and highlights bullish price momentum.
Helps identify price levels for risk management: A golden cross is a transparent reference point when setting prices for buy or sell orders. Traders often monitor MAs after a golden cross to confirm trend continuation and choose significant price zones on these trendlines to place stop-loss or take-profit orders.
Confirms other technical indicators: Because golden crosses are simple to spot, incorporating them into a comprehensive technical and fundamental analysis is easy. Traders scan crypto charts for average volume levels, relative strength index (RSI) readings, and other chart patterns after noticing a golden cross to determine the probability of bullish momentum.
Golden Cross Cons
An inherently lagging indicator: Time lag is built into a golden cross. Since these chart patterns rely on historical price averages, they often appear after a significant rally is underway. So when a golden cross forms and confirms an upswing, traders likely miss a substantial portion of the bullish price move.
Potential for false positives: When a digital asset’s market price suddenly swings up, it sometimes creates a short-lived golden cross, which is a false flag rather than a bullish trend confirmation. These deceptive crossover patterns are especially common when comparing two MAs on shorter time horizons, especially with intraday charts. Since cryptocurrencies have high volatility even on long timeframes, short-duration MAs don't have as much data to smooth out the averages, resulting in more golden cross fakeouts.
Crowded trades: When a golden cross is imminent, it's no secret in the crypto community. News publications and social media accounts frequently post about an impending golden cross for major cryptocurrencies like Bitcoin and Ethereum (ETH). Since these patterns are widely publicized, they don't give traders an edge over the competition and sometimes result in higher volatility and overinflated prices as traders pile into the heightened bullish sentiment.
Not ideal for microtrends: Golden crosses are most reliable when traders use longer-duration MAs to confirm a bullish trend instead of intraday price feeds. Since cryptocurrency prices sometimes move erratically day-to-day or minute-to-minute, golden crosses are more common and less reliable for microtrend traders.
How do Traders Use the Golden Cross in Crypto Trading?
As the short-duration MA inches closer to the long-term MA, it's common for crypto traders to feel bullish about near-term price action and create strategies to capitalize on an uptrend. However, traders often incorporate golden crosses into a more comprehensive technical analysis before deciding to enter or exit the market. Instead of solely relying on golden crosses, traders consider how this pattern fits in with other metrics for a cryptocurrency to ensure there aren't any conflicting data points.
For example, if other bullish indicators like above-average trading volume, positive news, and patterns like ascending triangles aren't present, golden crosses may be false positives. In contrast, if there's supporting evidence for bullish momentum in addition to a golden cross pattern, traders often consider these indicators genuine and enter a long position. Even if traders feel confident in a golden cross pattern, most choose price levels for automatic buy and sell orders to take emotions out of the equation and manage risk.
Prep for All Market Scenarios with Crypto Perps
Whether crypto markets turn bullish or bearish, dYdX helps eligible traders shift their strategies and enter positions with precision. On dYdX's decentralized exchange, eligible traders have the option to long or short dozens of crypto perpetual contracts and set up parameters like slippage tolerance and stop-loss orders. dYdX also offers eligible traders up to 20x leverage to enhance their position.
For more details on dYdX's latest features and upgrades, head to our official blog. Also, for more info on topics like crypto trading strategies and technical analysis, browse the articles on dYdX Academy.
Eligible traders can start trading on dYdX today!
Disclaimer
The content of this article (the “Article”) is provided for general informational purposes only. Reference to any specific strategy, technique, product, service, or entity does not constitute an endorsement or recommendation by dYdX Trading Inc., or any affiliate, agent, or representative thereof (“dYdX”). Use of strategies, techniques, products or services referenced in this Article may involve material risks, including the risk of financial losses arising from the volatility, operational loss, or nonconsensual liquidation of digital assets. The content of this Article does not constitute, and should not be considered, construed, or relied upon as, financial advice, legal advice, tax advice, investment advice, or advice of any other nature; and the content of this Article is not an offer, solicitation or call to action to make any investment, or purchase any crypto asset, of any kind. dYdX makes no representation, assurance or guarantee as to the accuracy, completeness, timeliness, suitability, or validity of any information in this Article or any third-party website that may be linked to it. You are solely responsible for conducting independent research, performing due diligence, and/or seeking advice from a professional advisor prior to taking any financial, tax, legal, or investment action.
You may only use the dYdX Services in compliance with the dYdX Terms of Use available here, including the geographic restrictions therein.
Any applicable sponsorship in connection with this Article will be disclosed, and any reference to a sponsor in this Article is for disclosure purposes, or informational in nature, and in any event is not a call to action to make an investment, acquire a service or product, or purchase crypto assets. This Article does not offer the purchase or sale of any financial instruments or related services.
By accessing this Article and taking any action in connection with the information contained in this Article, you agree that dYdX is not responsible, directly or indirectly, for any errors, omissions, or delays related to this Article, or any damage, injury, or loss incurred in connection with use of or reliance on the content of this Article, including any specific strategy, technique, product, service, or entity that may be referenced in the Article.