

When money is on the line in the fast-paced crypto market, it's easy for traders to feel flustered. No matter how much experience they may have, determining the optimal time to place an order is not always an easy decision.
Since nobody has a crypto crystal ball to peer into the future (or so we think), many traders rely on technical patterns and indicators to make calculated bets on the direction of crypto assets. For example, some seasoned traders look for a bull flag pattern when scanning crypto charts before hitting the "buy" button. Although bull flag patterns aren't always accurate, they can provide traders with useful info when setting up their positions.
Understanding bull flag patterns and the techniques to spot them can help you gather more valuable data and simplify the decision-making process. Here’s everything you need to know about these market times and how they differ from bearish flag patterns.
What is a Bull Flag Pattern in Crypto?
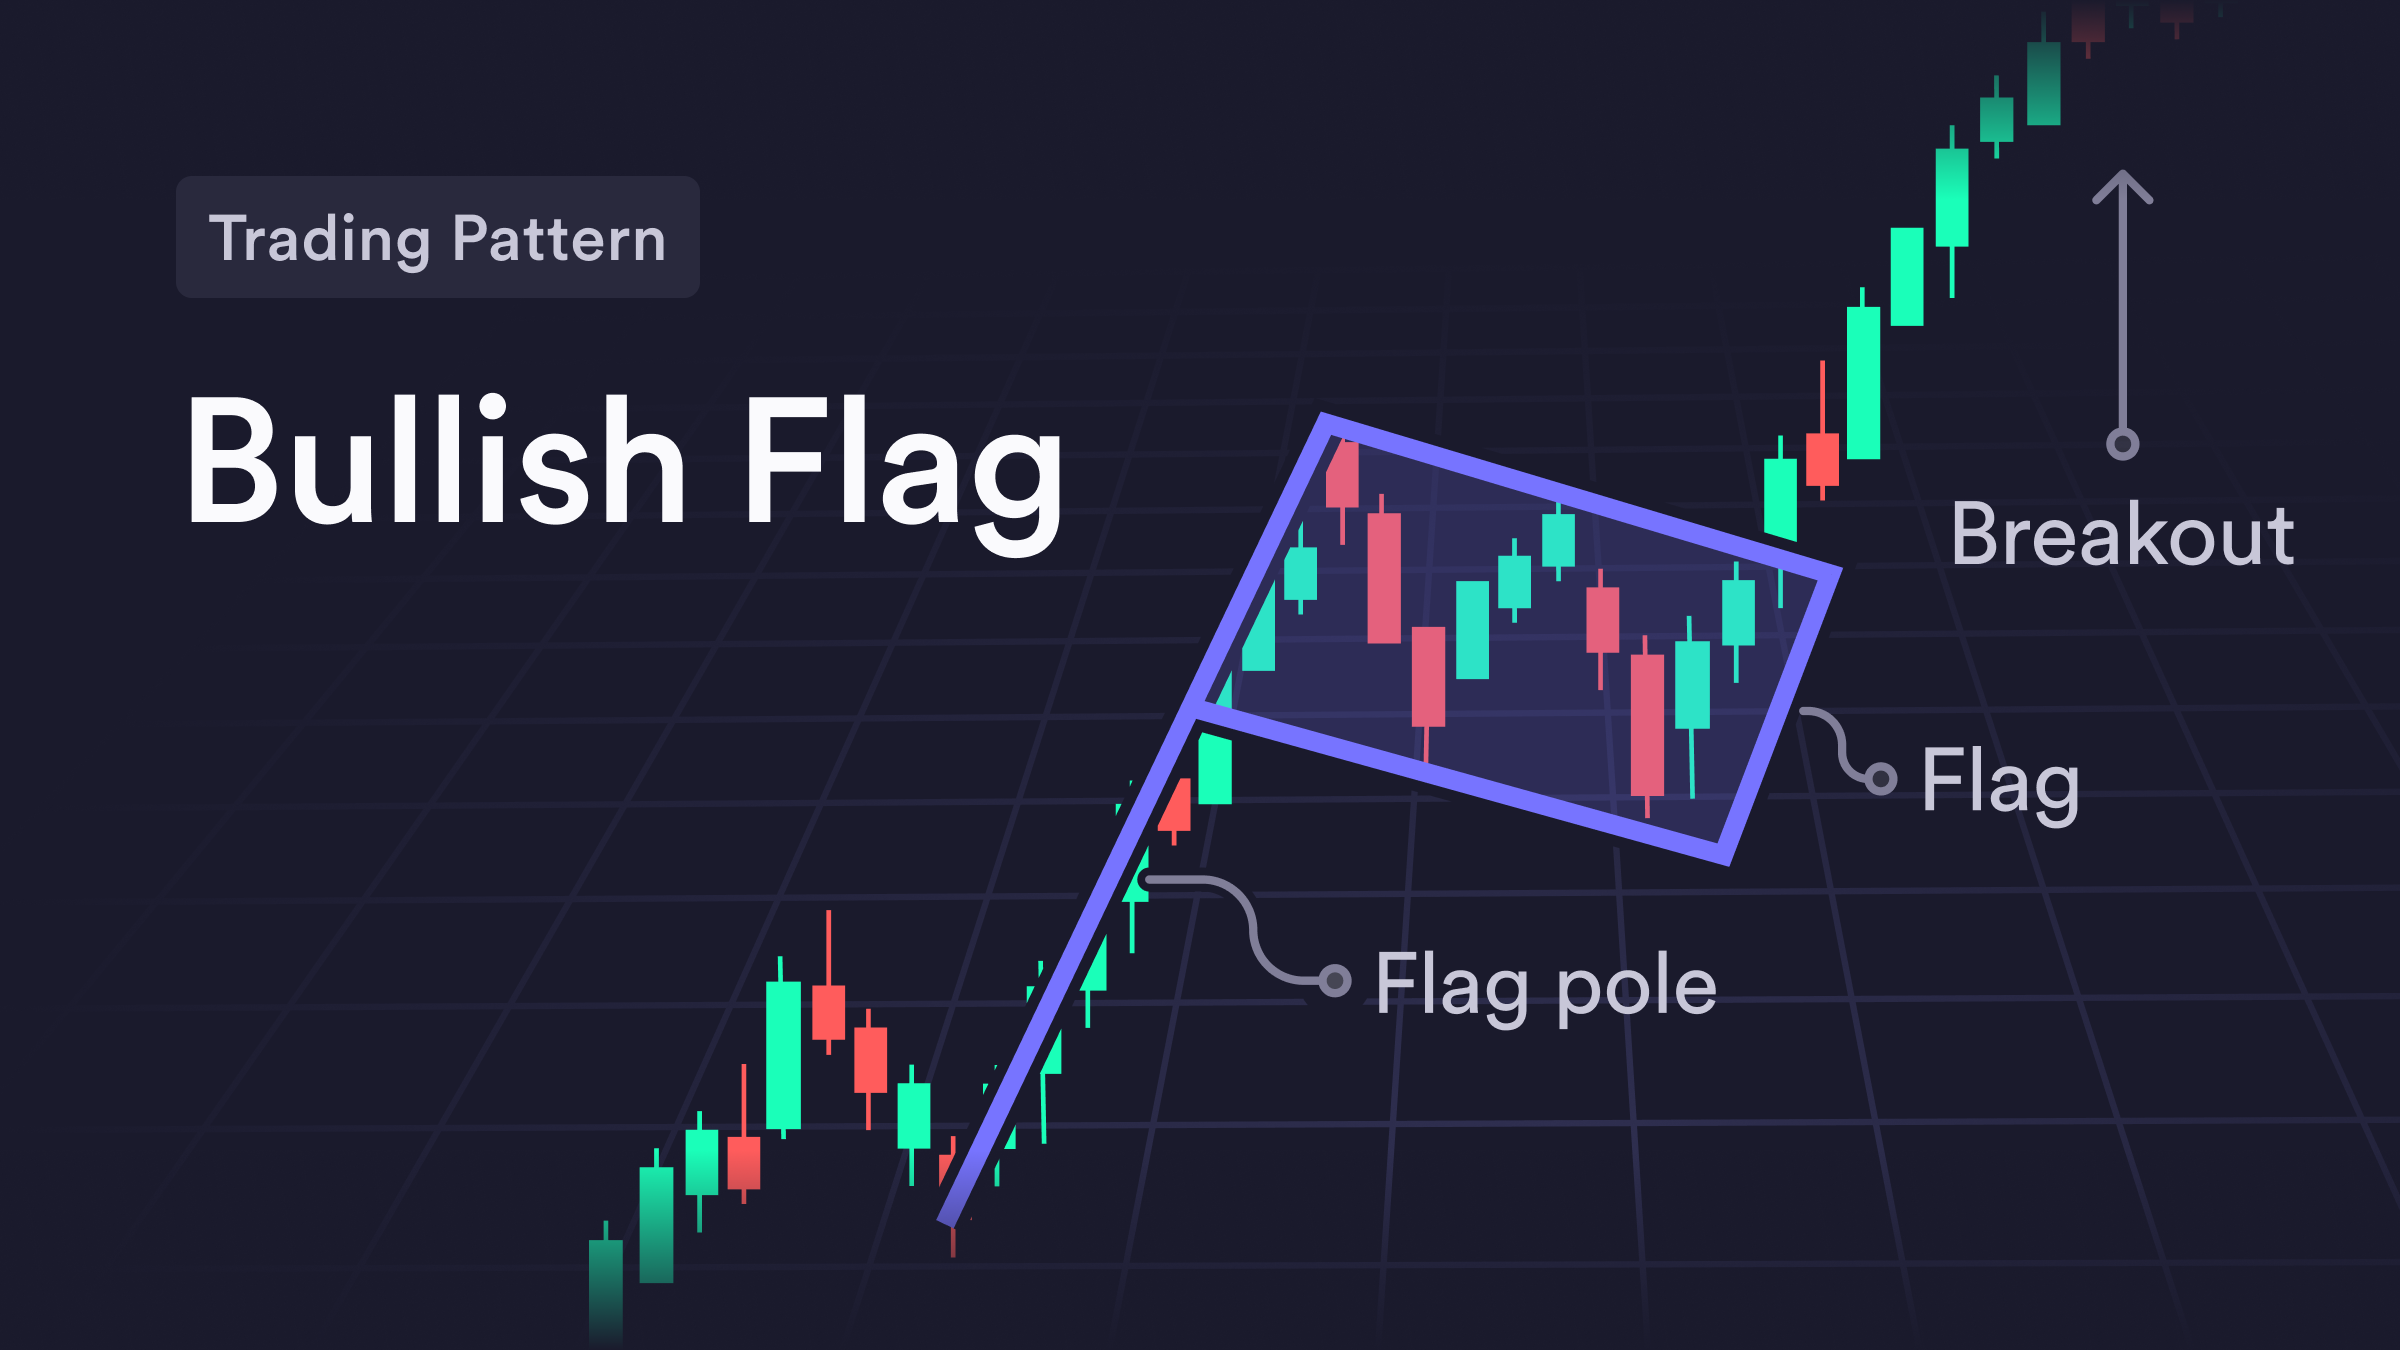
A bull flag pattern is a shape composed of candlesticks on a cryptocurrency's price chart that looks like a flag attached to a flagpole. A bull flag's flagpole portion refers to steep green candlesticks as a cryptocurrency's price rises. These long green bars are followed by shorter red and green candlesticks to create a waving flag shape. These flags are either horizontal or slightly downtrend with a tight and predictable price range. If the bull flag pattern plays out as expected, the flag portion eventually breaks the top resistance level in its price channel and rises higher.

Traders classify bull flags as a continuation pattern because the flag section only represents a brief pause (also called consolidation) in the overall bullish trend for a cryptocurrency's price. Since the bias of these patterns is bullish, traders typically enter long positions during the flag phase to capitalize on further upward price movement.
Besides a flag’s image on a flagpole, bull flags usually have distinctive trends in the volume bars on the bottom of a candlestick chart. Traditionally, a bull flag pattern has higher-than-average volume as a cryptocurrency's price rises during the flagpole stage, followed by decreasing volume when consolidation starts. In a classic bull flag, there's a spike in volume as the flag portion nears its end and the new price breakout materializes.
How to Trade a Bull Flag in Crypto: A Few Considerations
Crypto traders commonly use bull flag patterns as an entry signal to buy a crypto asset they believe has further upside. Since a bull flag can signal an intact trend with imminent higher highs, it's a popular pattern for momentum traders. Traders may step into a crypto position during the lows of a flag phase or as they notice the start of a new price breakout with higher volume. The goal of trading a bull flag pattern is to profit from buying an asset during the brief consolidation phase to leverage another price spike.
While the general trading strategy for bull flags is easy to understand, there's always a possibility this pattern doesn't play out, or traders make a mistake when analyzing price data. To prevent losses in these scenarios, some traders study the prices a cryptocurrency bounces off during the flag phase to set precise orders. They also calculate how much they're willing to risk on a trade versus what they hope to gain.
For example, suppose Bitcoin has a massive price spike and then forms a horizontal flag price pattern between $30,000 at the top and $29,600 at the bottom. Here, traders expect the flag to eventually burst through $30,000 for a bullish continuation, so they place an order to buy Bitcoin slightly above $30,000 when it confirms its breakout and a stop-loss order at $29,600. The stop-loss at $29,600 protects traders if Bitcoin's price doesn't follow through after its price breakout.
Traders also use take-profit orders to automatically sell a position if a cryptocurrency breaks out to secure a profit from their positions.For example,f a trader sets a take-profit order at $31,000, they risk $400 if BTC falls to $29,600 but can potentially gain $1,000. This way, spotting and analyzing bull flag patterns help traders set their price levels and define their risk.
Bull Flags Versus Bear Flags: How to Spot the Difference
Bear flags are continuation patterns similar to bull flags and look the same with long candlestick flagpoles and brief flag consolidation phases.
However, the difference between these patterns is that bear flags start with steep red candles and suggest further downside after the flag phase is over. Also, unlike bull flag patterns, bear flags don't always have significantly lower volume during the flag phase. Although the flag portion of a bull flag seems relatively stable than the previous drop, trading volumes often remain steady or slightly above average before increasing further ahead of another selloff. Because bear flag patterns suggest a cryptocurrency's value is falling, traders use strategies like put options or short perpetuals to cash in on the downward momentum.
Is a Bullish Pennant the Same as a Crypto Bull Flag?
The bullish pennant formation is a variation of the bull flag where the flag portion of the pattern resembles a sideways triangle rather than a horizontal box or a downward channel.
After the initial flagpole upward, a cryptocurrency’s price gradually narrows during consolidation until it reaches the tip of a pennant's flag. Since bullish pennants are continuation patterns, traders expect the price to break upward once the pennant appears.
How Long Does a Bull Flag Pattern Last in Crypto?
There's no standard duration for how long a bull flag pattern lasts, and each trader uses different timeframes when searching for this pattern. For example, some short-term traders look for microtrends on charts with candlesticks symbolizing seconds or minutes of price data, while swing traders look for bull flag patterns in daily or weekly charts.
When scanning for bull flag patterns, traders often analyze a combination of price charts and volume graphs. Although there's no average length a bull flag pattern lasts, they're usually short-duration trends and typically don't last longer than a few weeks.
The Risks of Bull Flag Patterns
While bull flag patterns might demonstrate brighter times, they come with their own set of drawbacks. And knowing these beforehand can help you estimate a more intelligent risk profile.
The most significant con for traders using bull flags is becoming overly reliant on this technical pattern. Although bull flags provide a lot of price information to traders, they're not always definitive. If traders see a bull flag, it's best to view this data in the context of other technical indicators and fundamental metrics before placing a trade. For example, was there any news for a cryptocurrency to support its bullish move higher (e.g., a successful software update or new official policies on cryptocurrencies)? If there are solid fundamentals behind a recent uptrend, there's typically more reason to believe the upward momentum continues after a bull flag emerges.
In contrast, if there's a bull flag shape without supporting data or news about a digital asset, traders may not feel as convinced this shape will follow through. Again, bull flag patterns are a helpful technical indicator, but traders often use them as a contributing piece of data when building their trading strategy.
Eligible Traders: Set Your crypto Trading Strategy on dYdX
Whether traders are bullish or bearish on a cryptocurrency, dYdX has the tools to set up the perfect trade.
On dYdX's decentralized derivatives exchange, eligible traders have access to Bitcoin and altcoin perpetuals, slippage tolerance controls, and multiple order types to pinpoint your preferred price levels. For more info on dYdX's latest features and updates, check out our blog. Also, swing by our dYdX Academy for more guides on essential crypto trading topics, and eligible traders can start trading on dYdX today.
Disclaimer
The content of this article (the “Article”) is provided for general informational purposes only. Reference to any specific strategy, technique, product, service, or entity does not constitute an endorsement or recommendation by dYdX Trading Inc., or any affiliate, agent, or representative thereof (“dYdX”). Use of strategies, techniques, products or services referenced in this Article may involve material risks, including the risk of financial losses arising from the volatility, operational loss, or nonconsensual liquidation of digital assets. The content of this Article does not constitute, and should not be considered, construed, or relied upon as, financial advice, legal advice, tax advice, investment advice, or advice of any other nature; and the content of this Article is not an offer, solicitation or call to action to make any investment, or purchase any crypto asset, of any kind. dYdX makes no representation, assurance or guarantee as to the accuracy, completeness, timeliness, suitability, or validity of any information in this Article or any third-party website that may be linked to it. You are solely responsible for conducting independent research, performing due diligence, and/or seeking advice from a professional advisor prior to taking any financial, tax, legal, or investment action.
You may only use the dYdX Services in compliance with the dYdX Terms of Use available here, including the geographic restrictions therein.
Any applicable sponsorship in connection with this Article will be disclosed, and any reference to a sponsor in this Article is for disclosure purposes, or informational in nature, and in any event is not a call to action to make an investment, acquire a service or product, or purchase crypto assets. This Article does not offer the purchase or sale of any financial instruments or related services.
By accessing this Article and taking any action in connection with the information contained in this Article, you agree that dYdX is not responsible, directly or indirectly, for any errors, omissions, or delays related to this Article, or any damage, injury, or loss incurred in connection with use of or reliance on the content of this Article, including any specific strategy, technique, product, service, or entity that may be referenced in the Article.


