

Crypto trading’s goal is straightforward: maximize gains and minimize losses.
Grasping these success markers is easy, but choosing the "best" time to buy or sell virtual coins is considerably more complex. It takes years for crypto traders to test different techniques, assess results, and build the perfect strategy per their risk tolerance and preferences. There are, however, a few chart patterns technical traders often use to predict the next move for a digital asset and profit from the crypto market's wild price swings.
For example, the ascending triangle pattern is a popular signal for crypto traders itching to deploy capital and set sky-high price targets. Let’s explore what the ascending triangle pattern means on a crypto chart, how to find it, and ways to use it to enter and exit positions.
What is an ascending triangle chart pattern?
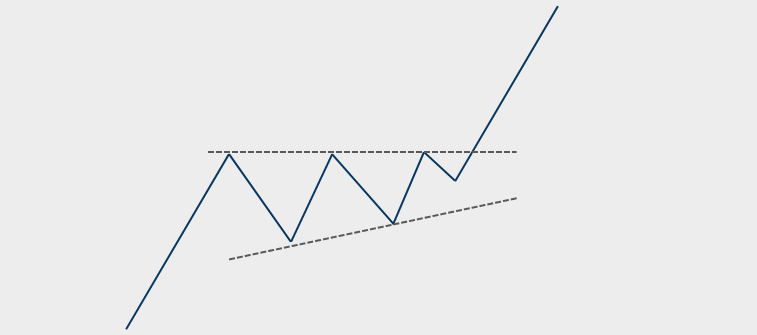
An ascending triangle pattern is an outline around a cryptocurrency's price, which looks like a triangle with a horizontal line on the top and an upward-tilted trendline on the bottom. In this visual pattern, the crypto asset's price constantly bounces off the up-slanting line, but it repeatedly fails to break through the price at the upper horizontal line.

Typically, ascending triangles are interpreted as continuation patterns, meaning traders might expect the crypto asset's price to continue moving in the same general direction after it reaches the narrow point of the triangle. Since the price for cryptocurrencies in ascending triangles continuously makes higher lows, the bias for this pattern is upward (aka a bullish pattern). As long as the prices stay within an ascending triangle's upper and lower lines, often traders assume a cryptocurrency’s price is set to break out higher when it reaches the end of the triangle.
How to spot an ascending triangle on a crypto chart
The two critical features of ascending triangle patterns are a series of higher lows and a firm horizontal resistance line at the top of the cryptocurrency's price range. Crypto traders draw a line across the high-end price level and on the bottom of the price lows on a cryptocurrency's candlestick chart to visualize this setup.
Besides looking at the price data, ascending triangles sometimes have spikes in average daily trading activity represented by volume bars on the bottom of a price chart. Traders consult volume levels to see if there's a noticeable increase in activity as an ascending triangle nears its breakout point. Generally, higher-than-average volume near the end of an ascending triangle pattern signals a significant price move for the digital asset.
How to use a rising triangle pattern: Listing common crypto trading strategies
Ascending triangles have a bullish bias, so traders often use them to buy positions (or go long) in a cryptocurrency––expecting an uptrend. Here, a trader waits until the ascending triangle has multiple confirmations with higher lows and repeated rejections at the horizontal line, and they place buy orders as the crypto asset approaches the end of the pattern.
Sometimes, traders measure the difference between the cryptocurrency's lowest price in the triangle and the horizontal resistance line to estimate the potential size of a breakout candle. While there's no way to guarantee how far a cryptocurrency's price moves—or if it moves at all—this measurement gives traders a way to set their expectations and target price levels.
Although buying into bullish breakouts is a traditional method for trading ascending triangles, crypto traders use other ways to incorporate these formations into their strategies. For example, if a cryptocurrency's price falls below the support zone on the ascending line (especially with high volume), traders enter positions profiting from price declines (e.g., selling short or buying put options).
Some day traders also use ascending triangles as a form of short-term range trading where they buy crypto assets when they touch the bottom of the ascending triangle and try to sell them as they approach the horizontal resistance line.
What are descending triangle patterns?
As the name suggests, descending triangle patterns are the inverse of their ascending counterparts, characterized by multiple lower price highs rather than higher lows.
In these downtrend triangles, the horizontal line is at the bottom of the cryptocurrency's price range and serves as a support zone where prices bounce multiple times. The consistently lower highs for a crypto asset form a downward-sloping upper trendline, which eventually reaches a corner at the support zone. As long as the cryptocurrency's market price doesn't break above the upper-tilted line in a descending triangle formation, the bias for this formation is downward (or bearish). As the cryptocurrency's price reaches the end of the descending triangle formation, most traders expect a dramatic fall below the support line with higher-than-average volume.
Precautions to take when triangle pattern trading
Both ascending and descending triangles are well-established patterns and easy-to-understand tools, but they're never guaranteed to turn out as expected. There's always the potential that these triangles are false flags and a cryptocurrency's price moves in the opposite direction (aka a false breakout).
Also, spotting ascending and descending triangles is relatively simple, which may lead to crowded trades where more traders than average pile into a position seeking to capitalize on the pattern's typical outcome. On the positive side, crowded trades sometimes lead to profitable self-fulfilling prophecies where prices move in the expected direction simply because market participants believe it’ll happen. However, since so many traders in crowded crypto are positioned the same way, it increases the risk of significant price volatility, market manipulation, or panic selling—especially if the pattern doesn't turn out as expected.
To prevent getting caught in unfavorable positions, traders use ascending and descending triangles as part of a larger trading strategy, including researching supporting technical indicators, analyzing crypto market news, and studying the fundamentals behind a crypto project. The more bullish or bearish signs a crypto trader sees for a digital asset, the more points of evidence they have to build a comprehensive trading thesis.
Traders also use chart patterns like ascending triangles to assess the best price levels for buying or selling digital assets according to their risk-to-return ratios. For example, if a trader wants to enter a Bitcoin (BTC) trade to earn $1,000 and lose no more than $2,500, they simultaneously set a take-profit order $1,000 above the price they bought BTC and a stop-sell order $2,500 below their BTC entry price. Here, even if the ascending triangle pattern doesn't lead to a bullish breakout, the trader can't lose more than $2,500. The visual cues of crypto chart patterns are an effective way to choose the ideal profit targets and sell levels to minimize emotional decision-making when jumping into the crypto market.
Eligible traders can set up perpetual swap strategies on dYdX
For eligible traders, dYdX offers a secure decentralized exchange to set up technical trades on Bitcoin and altcoin perpetual contracts. Because perpetuals don't have expiry dates, they provide a convenient way to set long or short positions to hedge or speculate on price dynamics. Plus, with dYdX's advanced order types and slippage tolerance controls, eligible traders can easily pinpoint the parameters of their trades. Learn more about how dYdX works and our latest features on our official blog. For more educational content on cryptocurrencies and trading techniques, check out our education hub on dYdX Academy, and eligible traders can start trading on dYdX today.
Disclosures
The content of this article (the “Article”) is provided for general informational purposes only. Reference to any specific strategy, technique, product, service, or entity does not constitute an endorsement or recommendation by dYdX Trading Inc., or any affiliate, agent, or representative thereof (“dYdX”). Use of strategies, techniques, products or services referenced in this Article may involve material risks, including the risk of financial losses arising from the volatility, operational loss, or nonconsensual liquidation of digital assets. The content of this Article does not constitute, and should not be considered, construed, or relied upon as, financial advice, legal advice, tax advice, investment advice, or advice of any other nature; and the content of this Article is not an offer, solicitation or call to action to make any investment, or purchase any crypto asset, of any kind. dYdX makes no representation, assurance or guarantee as to the accuracy, completeness, timeliness, suitability, or validity of any information in this Article or any third-party website that may be linked to it. You are solely responsible for conducting independent research, performing due diligence, and/or seeking advice from a professional advisor prior to taking any financial, tax, legal, or investment action.
You may only use the dYdX Services in compliance with the dYdX Terms of Use available here, including the geographic restrictions therein.
Any applicable sponsorship in connection with this Article will be disclosed, and any reference to a sponsor in this Article is for disclosure purposes, or informational in nature, and in any event is not a call to action to make an investment, acquire a service or product, or purchase crypto assets. This Article does not offer the purchase or sale of any financial instruments or related services.
By accessing this Article and taking any action in connection with the information contained in this Article, you agree that dYdX is not responsible, directly or indirectly, for any errors, omissions, or delays related to this Article, or any damage, injury, or loss incurred in connection with use of or reliance on the content of this Article, including any specific strategy, technique, product, service, or entity that may be referenced in the Article.


